In its second season, the Longevity & Aging Series is a video series that features esteemed researchers discussing the latest in aging research with a focus on their studies published by Aging.
—
Below is a transcription of the season 2 premiere of the Longevity & Aging Series, Dr. Irina Conboy and Xiaoyue (Serafina) Mei from the Department of Bioengineering and QB3 at the University of California, Berkeley, discuss a priority research paper they co-authored that was published in Volume 15, Issue 17, of Aging (Aging-US), entitled, “Fail-tests of DNA methylation clocks, and development of a noise barometer for measuring epigenetic pressure of aging and disease.”
Hello everybody. Let me introduce Serafina Mei who is going to give a presentation together with me today. And she is the first author on the study that we are going to discuss. She is a first-year PhD student in the Department of Bioengineering UCSF, UC Berkeley, graduate group in engineering. She did the lion’s share award on this interesting study, including development of a novel quantification of biological age, which is a noise barometer.
Xiaoyue (Serafina) Mei
Hello everyone. I’m Xiaoyue Mei or Serafina. This is our senior author of the paper, Professor Irina Conboy, who has a main interest in aging research. Our lab worked under the Berkeley Bioengineering Department. Really appreciate Aging journal for this opportunity for us to share our knowledge with you on biological noise.
Dr. Irina Conboy
So we’ll start with discussions of how we got interested in the idea of biological age and biological clocks, which is quite logical because our main focus in research is on understanding the fundamental process of aging and developing novel technologies, methods, and therapeutics that can slow down the process of aging and possibly reverse it. So on this quest, of course, one needs to know what is biological age and how to measure it. And so we were super excited to be asked to collaborate with clockmakers because we thought, “This is great. We’ll be able to see if we can distinguish between animals or how people who are young, old originated.” And to our surprise, instead of simply providing them with randomized and numerically labeled samples, they said, “Oh, no, no, no, this is not going to work. You need to label your samples and tell us their age. So once you tell us the age, we can predict it.”
The question then was, is it really a clock? For example, if you have a clock, you don’t need to tell a person what time it is, so then they can tell you back what time it is. If it is 2:00 PM then the next minute it will be 2:00 PM plus one minute. So that will be a normal clock. But in so-called dynamic methylation clocks or proteomics clocks, the time is not really known. Every time you need to tell the person what time it is and then the next day it will not be the same biological age as you had today. It could be five years older or three months younger. So that introduced many, many questions in our mind. And the first question was, what are the biological age clocks? How are they different from typical clocks and how do they work?
Xiaoyue (Serafina) Mei
I agree with Professor Irina. Before we launched this project, I was aware that over the years, many researchers have developed various machine learning algorithms, mainly regression models to predict age based on DNA methylation patterns or protein patterns. Elastin does a pretty decent job making relatively accurate predictions, but is the model really biologically sound? I’m more interested in finding biologically meaningful factors rather than just outputting a number called DNA methylation age without knowing why certain signals are selected and ranked in a certain way. So we are interested to find out if these predictions are useful for biologists or clinicians and are they even reflective of age-specific or disease-cost change in DA methylation.
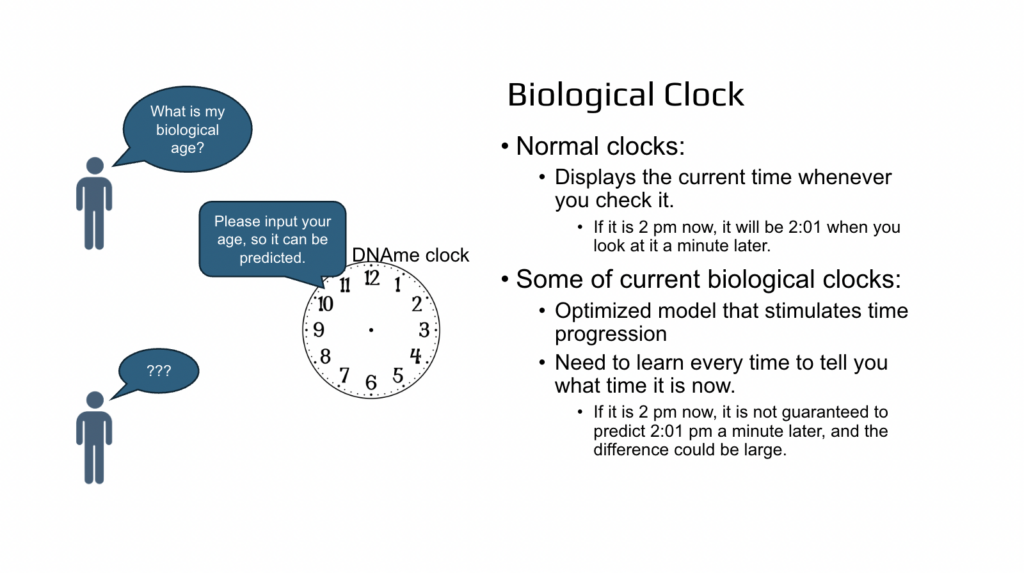
And so to summarize, normal clocks display the current time whenever you check it, and the current biological clocks are just a simulated time and you need to input what time it is now so then the clock can predict it back to you. Big difference.
So the next point or the next surprise was from trying to figure out how you go from a random pattern of epigenetics in the human population to today’s very nice linear pattern. Very often, when there are talks or papers presented on biological clocks, the figures start with this very nice linear pattern where each dot is an individual and you see that they’re more or less precisely aligned together, such as progression of aging based on the predicted age or methylation or proteome age is linear, very precisely so, almost 99% accuracy linear. But when you look at the primary experimental data, it doesn’t look linear at all. And performing tissue clustering analysis shows that yes, there are different clusters of DNA methylation or epigenetics among people, but if you look at the age, we do not cluster by age. There are no more or less young or old people in these clusters.
There is no natural or physiologic progression of aging that is either linear or that is clustering automatically by age, such as all young people are in one cluster and then middle-aged, and then old. So how exactly do you go from this primary experimental result to this linear model? It is clearly not what is happening in the biological realm or in the physical world where we live. Additionally, there is also a reality check such as that you know that you do not go through life chronological aging linearly. For example, at the end of life or later on, many people have gray hair, gray head of hair, but it does not happen because every day one of our hairs becomes gray and then two hairs and three hairs until eventually the whole head is now gray. Obviously that is not how we go through age or aging, and there are clearly known how to plateau or several plateaus.
So the question is, how do we get from various possibilities of going through aging such as it could be oscillating, it could be exponential, it could be plateau followed by increase. We don’t really know how you go through aging? You know that it is not linear from the body of biomedical research. And this will be true if you look at the functions of organs and systems or if you look at the molecules inside the cells, for example, DNA methylation or proteins. In every single situation, we know that young will be different from old and there are many, many biomarkers which will tell us who is young and who is old, but we don’t know the progression. How do we go from young to old? There are many possibilities. So here is the question mark. And so what then is turned out that all of these possibilities or the natural course of progressions of aging are erased during mathematical simulation by the statistics methods called elastic net regression.
So you say, let’s assume that it is not important how do you really go through aging and mandate that we age linearly? Let’s just say that this happens like that. And there are several problems with that because the first problem is that even if you say that, let’s assume that you go through aging linearly, the universe is not going to obey and we’ll not go aging linearly. And the second problem is that by mandating this progression in mathematical simulation, we then prevent ourselves from learning the nature or cure for aging. How do they actually age? So the next point that was not so much of a surprise but is important to consider, is that when we are talking about the methylation or epigenetics, this is not based on the sequencing. This is based on a less precise assay, which is very good because it allows us to analyze thousands of samples simultaneously.
It’s a high throughput assay, but it sacrifices precision to some extent. It’s called DA methylation array and it is done on bulk cells or tissues. Two pieces of DNA are aligned to each other and they’ll stick to each other. If they stick to each other, the resulting color output from the instrument will be let’s say green, and some of them stick and some of them don’t. It’ll be in between. It’ll be slightly less green or in other approaches it could be yellow if unaligned pieces of DNA are red. If unaligned pieces of DNA are just without any color, then it’ll be less green. And each of these pieces of DNA also have the opportunity to bind elsewhere and not necessarily detect the likelihood of methylation of one cytosine. So this is the approach.
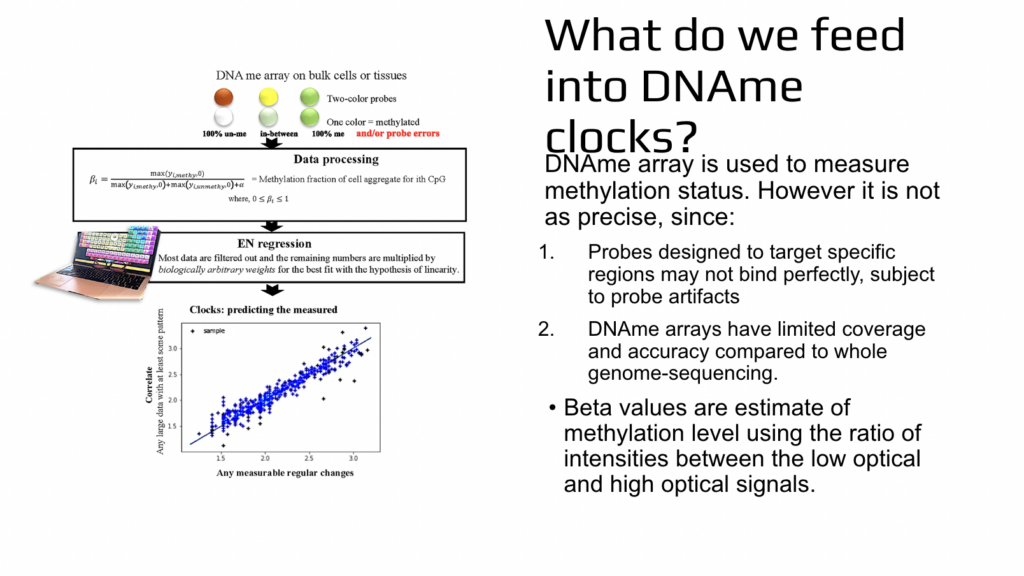
And then there is lots of data processing where in the end we get so-called beta values and beta values are relatively fast too much or whether cytosine was methylated or not. We don’t know it for sure, but in relative terms we know the likelihood is more likely or less likely. After that there is elastic net regression, which is a machine learning method and Serafina will tell you more about it. And what happens there is that, we are selecting a high subset of results from this high throughput, not very precise experiment. And not only we are doing that, but each data is then weighted. So they are multiplying it by different numbers. And machine learning or computers are literally searching for these weights which are biologically meaningless. There is no reason to use them, but there are mathematical solutions for the low star square or for bringing all of the results into this artificial simulated straight line.
So biologically, it is artificial. Mathematically, it’s very meaningful because once this linear correlation between X and Y is produced by using training of a model and then testing training of a model, then from this correlation of course you can see that X can be predicted from Y or Y can be predicted from X, the least erroneously throughout this whole correlation. So now we are switching gears and Serafina is going to tell you more in depth about elastic net regression.
Xiaoyue (Serafina) Mei
Thank you Professor Irina for the very informative overview. So elastic net was developed in 2005 by Hastie group to handle high dimensional, very complicated data sets. It has applications now across many different areas such as physics, chemistry, bioinformatics, and all other engineering applications. But in each area there are specific components or mechanisms that determine whether it is appropriate to apply this approach because of the certain assumptions that elastic net hold. So elastic net selects several variables to be included in the formula and assigns a coefficient to each of them, together forming this formula that outputs the predicted value for the dependent variable. During this process of feature selection and coefficient assignment, it combines the strengths of two popular methods. Lasso and Ridge regression. Like Lasso, elastic net can help you select important features by setting some coefficients to zero, making the model simpler. And also like ridge regression, it helps deals with correlated features by shrinking their coefficients.
So the process of figuring out what is the best value of coefficient to assign to each feature is called gradient descent. This method involved repetitively matching the error made by the model and then tweaking the value for each factor a little bit to make the error smaller. The same is to keep doing this until the model’s errors are as small as possible, looking at both the size of the error squared and also their absolute value. So elastic net is a very powerful linear regression model, but when it comes to biological information such as epigenetics, that is supposed to be very responsible to everything around us. For example, in reality things like what time during the day of the measurement and your current workout or emotional fluctuation at the present can all lead to change in your epigenetics, making it almost impossible to predict epigenetic changes in this complex dynamic and imprecise real world context. However, within the confines of an idealized computer model, predictions of all these changes can achieve maximum accuracy.
Dr. Irina Conboy
I would like just to summarize here, is that, in real world the data is variable for each age and is dynamic because epigenetics, as Serafina mentioned, is influenced by our mood, by the weather outside, by our financial status to say nothing about such things as coffee drinking, smoking and so forth. And so we would not be able to predict people’s DNA methylation age, if we actually looked at the real world data. But in a mathematical simulation, we are predicting it because we are multiplying the real data by the weights and we literally search using a computer how to do it. So then the data is linearized as much as possible or as best as possible. That gives us a very accurate prediction, but it does not change the fact that epigenetics did not become different in the real world. And what we are predicting exists now in the mathematical universe, it is a simulation. And so then the next set of questions are, is this simulation biologically meaningful? And while we are changing, not changing, but weighting experimental results by the numbers that are biologically arbitrary, can we see that our conclusions about biology are still accurate?
Xiaoyue (Serafina) Mei
I will briefly cover the advantages of elastic net. So besides assumption of linearity, there are also some special features that distinguish elastic net from other linear regression models. So for example, when it comes to among a group of highly correlated features, elastic net tends to select only one as the most representative and disregard the rest to a wide redundancy. This is like Lasso. And elastic net also tries to maintain a simple model, simple in terms of number of parameters and the easier interpretation compared to reach regression. Meanwhile, elastic net mitigates the coefficient sensitivities to small changes in the data to improve the overall generalizability in the model. And so overall elastic net uses these techniques to prevent overfitting and improve the model performance. This can be seen in the bottom row of figures where the blue line in each part is the line of perfect prediction, where the predicted age is equal to the actual chronological age for an individual.
But regardless of the health status, for example here we have five different studies and blue is always the healthy control group and the red are disease patients. But regardless of these health conditions, elastic net based models make fairly accurate predictions. As you can see, the dots are very close to the line of perfect prediction.
Dr. Irina Conboy
And I would like to add that these models were reconstructed based on how elastic net regression is usually trained and tested in the same fashion as clockmakers do. Thanks to the very good description of these methods in the groundbreaking papers on biological clocks. And there were these reconstructions or building of elastic net regressions were done from the same sets for 150K, Illumina array, DNA methylation, DNA methylation array. And as you can see, dot here is an individual and the accurate models can be constructed. Once again, this is a simulation of reality. These are not the experimental results per se, but weighted experimental results with the mandatory fit into the linear progression of aging. And what Serafina mentioned is also accurate is that, now when we test the model against overfitting on the data sets, which are from completely different groups, different studies, we see that we can clearly distinguish young people from old people and predict through this correlation age, chronological age accurately.
But unfortunately, it is predicted to be the same also for patients who have arthritis or down syndrome or even progeria Werner Syndrome. Cannot be predicted very well for people who are healthy from this experiment but are predicted more accurately for people who have broken one mutation or already have cancer. So couple of conclusions, biological relevance is not given in the simulation because people who are unhealthy and people who are very healthy are predicted to be of the same age and you know that is not to be true, that arthritis, premature aging, people, particularly blood cells, down syndrome, has various attributes on changing the age of the patients, biological age. Werner syndrome is known to be specifically progeric, but the elastic net regression is unable to make these determinations. Another point is that once the linear predictor or linear correlation was produced by using computers to make it as linear as possible, the physical meaning is no longer implied.
For example, people who live in the United States, how many people live in the United States? So yes, population can be very accurately predicted from DNA methylation results or epigenetics from one experiment. And you of course know that there is no physical reason why the number of people living in the United States will be correlated with epigenetics of people who were tested today or sometime recently. But we can do it because elastic net regression does not understand any meaning and it does not aim to create any meaningful connection between X and Y. It simply builds linear correlation from large data. And then after you train elastic net regression model and this linear correlation is produced, anything could be correlated. For example, how many people live in the United States or global temperature increases or even the stock market.
Using exactly the same predictor, the same Lasso set of CPGs and the same weights assigned to them, we can very, very accurately predict the chronological ages of the people. So we can predict many, many things, but it does not mean that there is a physical connection, to say nothing about biological connection. So that illustrates the point, is that correlation is not really causality and mathematical simulation is not going to change physical reality. And that brings me to the point that there are many different clocks that were generated and published recently. They’re all very interesting. So after first generation clocks, there is also pace or pace of aging. Pace of aging is based on the disease scores instead of the chronological clock. PhenoAge is based on the health scores instead of chronological clock. GrimAge is trained on the years that people have until their demise, how long they live until their natural death. And then pan-mammalian clocks measure chronological and or biological age hearts to tell for many mammals simultaneously from the proprietary custom DNA modulation array.
And then of course, age is changed on the intensity of signal transduction networks or regulatory signaling in the cell. But in all of this situation, the interesting point is that, what you are training on is a regularly changed set of numbers. In the first generation it’ll be our chronological age. It’s very regular chronological age, no doubt about it as linear, is 20 years, 30, 40, and until 100. But this will replace 20, 30 to 100 with numbers for example, 1, 2, 3, 4, 5. And that is the probability or incidence of disease. So when people are young, the incidence of disease will be low and then when they’re old it’ll be high. So from a mathematical perspective or even in principle, it’s not different. So we are training our clocks on regularly changing sets of numbers, be those 1, 2, 3, 4, 5 or 10, 20, 30, 40, to 100. And the same is true about the rest of the clocks.
So PhenoAge is the health score. So the health score is high in young people then becomes low. GrimAge, how long do we have to live, isn’t intricately linked to how long we already lived. The Pan-mammalian clock is a different iteration of the first generation and the other clocks. And because age just measures the intensity, so once again it’s 1, 2, 3, 4, 5 type of the progression. And once we have 1, 2, 3, 4, 5 type of progression, it’ll be all this a proxy or replacement for chronological age. So kind of in the same way that we measured how many people live in the United States or population numbers over the years, it is a proxy for chronological age because when people who are old now in their youth, there were less people who lived in the United States and now there are more and more people.
So what we are doing, we are just replacing chronological age with proxy numbers. And interestingly, computers do not understand: is it a health score, is it the stock market, is it how many people live in the United States? For a computer it’ll be just 1, 2, 3, 4, 5, 6, 7, 8, 9, 10. And then the computer builds linear correlation with those progression of numbers. So once again, biological meaning is not implied regardless of how we term the clock and regardless of our training, because we are bound by this idea that the clock has to be trained on linear progression. And every linear progression that we are selecting is just a proxy for chronological age, each clock creates a mathematical correlation.
Xiaoyue (Serafina) Mei
Thank you, Professor Irina, for the very detailed explanation for each biological clock. And as we have been emphasizing, elastic net is trained to make these accurate generalizable predictions for one’s chronological age regardless of their biological wellness. So if someone is 75 years old, elastic net model captures the patterns that can actually output 75 years where linear combination of data methylation or proteomics feature in all scenarios regardless of biological age. So as we can see in the bottom left of the figure here, the combined diseases are data sets of six different disease studies including arthritis, multi sclerosis, irritable bowel syndrome, Parkinson’s disease, Werner syndrome, and down syndrome. We use the PhenoAge as an example to predict the age of each patient in all disease data sets plotted in red and the healthy control people will be plotted in blue.
Here we see the prediction overlap between the healthy and diseased people and there seems to be more dots even under the line of perfect prediction indicating the high likelihood of age being under-predicted by PhenoAge. But when we think about the biological perspective for disease, it does not sound to be true because a lot of age-elevated disease like a Parkinson’s neurodegenerative disorder or arthritis, there have to be some influence aging that makes the person biologically older than a healthy individual of the same chronological age group. And on the right we use barographs to show the difference between predictions on healthy and diseased, that the difference is not statistically significant. This erases the true difference between healthy individuals and those with age-elevated disease.
Dr. Irina Conboy
And so what Serafina also mentioned very importantly, is that we tested performance of PhenoAge not in one experiment as typically shown in published papers but in six different studies. And when this was done, it is clear that the model is overall distinguishing young versus old individuals and can place them linearly with biologically arbitrary weights. But everybody is predicted to be younger than they are. This thin blue iron would be a perfect prediction. And in some cases there are 10 or more years of errors in predictions. That brings me back to the very first slide that we don’t have a clock because clocks typically give the same time in the same earth environment, in the same time mass matter constant. But biological age clocks give completely different times depending on which experiments you did and in which laboratories. And we’ll address that later on why that happens. With respect to the lack of difference between health and disease overlap of health and disease, that is a given conundrum of elastic net regression.
Because let’s say you’re trying to predict the age of somebody who is 70 most accurately, we are going to select certain cytosines and assign certain weights. So everybody who is 70-years-old will be in this one tight dot. But if people are healthy and 70 years old, their epigenetics is different from people who are patients and are 70 years old. But if you then identify that difference, you wouldn’t be able to predict them all as 70 years old, we would lose the accuracy. So in training this machine machine learning model, elastic net regression actually throws out and deselects anything of importance which will distinguish between health and disease because that will spoil the accuracy of prediction. So if you’re really doomed to pick only the cytosines, CPGs or features which remain the same in all 70 years old, and as you probably can guess, all 70 years old are not the same epigenetically and are not the same health-wise.
Xiaoyue (Serafina) Mei
Elastic net results always come from DNA methylation arrays here. So we assume that elastic net will select cytosines that change the most with age and assign them the highest weights or regard them to be the most important feature to determine age. But it turns out that elastic net does not rank Cytosines based on methylation change with age. On the left, we plot its correlation with age for each DNA methylation site or cytosine that elastic net selected with the coefficient that the elastic net assigned to each feature or how important elastic net ranked them. And we see that the features’ correlation is really not correlated to how important elastic net ranked it in the model. This is because there may be a group of cytosines that together change with age and elastic net only tends to keep one of them and remove the rest because they may have the same contribution to the predicted power.
And also, elastic net tends to retain some cytosines that are weakly correlated with age. So theoretically speaking, this lack of correlation is reasonable to prevent overfading ultimately and improve the performance of the model. However, from a biological perspective, not only that the features selected might not be biomarkers, such an approach may also exclude the true biomarkers of aging. Therefore, we should not expect our conclusions from this model to be biologically accurate.
Dr. Irina Conboy
And also since one of the goals is to have the lowest, fewer numbers of predictors to make the least erroneous predictions, then biomarkers would be actually thrown out if not only they are not retained and selected for, but they may be selected against as shown on the right part here. For example, the model zero, which is the most accurate predictor of age from DNA methylation array has on average very low correlation of DNA methylation changes with age. It’s 0.1, correlation 0.1. So as you see there are loads, lots of dots here, right almost at zero. So all of these cytosines do not change at all in their methylation with age. There is no change in DNA methylation with age. But elastic net regression selected them because they allow elastic net to predict age surprisingly. So this age prediction does not come from DNA methylation change, it doesn’t, even though our assay measures DNA methylation.
And even more surprisingly, once we throw out all of the selection and tell elastic net regression to start again without this best group, the next group has slightly better correlation in DNA methylation change with age. It’s now above 0.1. And we don’t have many of these cytosines right at the very bottom, meaning that some of them change a little bit in their dynamic methylation so they do reflect epigenetic change. And the second predictor works a little bit worse than the first one. So the bottom line is that, there is no scientific evidence thus far that the predictions actually reflect epigenetic changes. And please remember that they don’t have to be because any large data after training would be made into the linear correlation from which you can predict anything else, biological or not biological, physically connected or disconnected with the methylation. So then, Serafina is going to tell you about the next approach to test whether the selected CPGs are biomarkers or whether we are actually missing biomarkers.
Xiaoyue (Serafina) Mei
Another observation that we have made is that, if we randomly remove features that the model didn’t choose, it might take different features the next time. So theoretically speaking, this could be caused by the fact that the cytosines being removed may happen to share the same age correlation with some others, and therefore instead of selecting the most representative one among this group elastic net will select whichever is left in the group if some are removed. However, this lead us to further thoughts, how meaningful and consistent are the chosen features? Because from a biological perspective, biomarkers should not be subject to change. For instance, blood glucose level is a known biomarker of diabetes, but changing the irrelevant factors such as your hair color or apartment sizes you live in should not change the fact that blood glucose level remains as a biomarker for diabetes.
So if what the model selects actually can be regarded as biomarkers, they should always be chosen by the model. And like what is shown on the bottom figure, if we remove, for instance, 5% of the peak of the unused feature of the data, the model will abandon almost like 20% of the feature next time and maybe replace it with something else. This is definitely an inconsistency and that tells us that the markers chosen by elastic net should not be regarded as biomarkers.
Dr. Irina Conboy
That’s true. They don’t have properties of biomarkers because biomarkers do not really change and they remain super important and noticeable when we start discarding irrelevant features.
Xiaoyue (Serafina) Mei
So our study aimed to develop a more non-standard understanding of aging and disease progression. We focused on identifying epigenetic changes directly from the primary DNA methylation data using a novel approach in noise parameters to measure the level of dysregulation and detect the pressure of aging and disease.
Dr. Irina Conboy
And the most important question for me was, okay, so so-called clocks are saying, let’s pretend that we age linearly. And so my answer to that is, let’s not pretend that we age linearly. Can we identify the actual progression of aging? What is the real cure? Let’s not mandate it. And so that was the first point that was super important for me to answer. And then Serafina, George, we will mention an acknowledgement and Connor marvelously answered it. And then the second point is that, we have been looking for biomarkers in levels for decades and they remain very elusive, we did not find them. We looked at the levels of proteins and levels of DNA methylation or epigenetics, transcripts, functions and so forth. And that could be because there are no biomarkers of aging when you look at the levels. There are differences between young and old organisms for which there are tons of biomarkers, but there are no biomarkers of how do you progress, how do you go from being young to becoming old?
And so then the hypothesis was that it is not the levels, it is dysregulation or noise, which biomarks progression of aging. And because there is more dysregulation, levels go up and down, it is super difficult to find biomarkers and levels. We cannot find them. They just become highly variable. And then the true biomarker of aging is dysregulation or entropy or noise. And so then I was able to interest Serafina who did a lion’s share of work on that and really she’ll describe to you what noise barometer is and how it is different from mathematical simulation.
Xiaoyue (Serafina) Mei
Thank you, Professor Irina. So as Professor Irina said, we hypothesize that there are certain genes that are so vital our body tries to maintain them as we grow old. But at some point in later life they become dysregulated. An example of this cytosine shows early at age is really maintained around constant mean around 0.04. But as people grow older, there will be more and more variation in this cytosine methylation value, but it will constantly try to maintain this mean of 0.04. So our approach involves analyzing the methylation data to identify cytosines like this that remain on average stable in their methylation levels, whereas age-resistant but become noisier among older individuals.
Dr. Irina Conboy
And as you see, if you look at the average, this is not a level biomarker of age because on average it remains of similar levels between young people and throughout chronology. But if you look at the noise among different people who are young, middle-aged or old, we can clearly see that it is the noise or entropy or dysregulation or standard deviation or absolute different distance from mean that is the biomarker of aging progression.
Xiaoyue (Serafina) Mei
The first method we selected features based on correlation with their absolute distance from mean and age. So this approach yielded 50 methylation sites. Then we plotted the normalized sum of their absolute distance from mean and fitted up the polynomial curve. So on the bottom right where the calcium control group with the disease group, where we see the red dots are, the disease tends to be above the curve, especially during young adulthood into middle age, that indicates there is more biological dysregulation in arthritis disease patients compared to their healthy peers. And this difference still continues to exist later. So the biological relevance of this approach is the main point as these critically vital areas of the genome become more dysregulated aging and diseases become undeniable.
Dr. Irina Conboy
And also, I would like to mention that each dot here is not an individual. There are many more people, but each dot here is an age interval. So there are many people who are in this age interval and this one and this one and so forth. And that the healthy individuals’ aging progression could be described by this polynomial curve where first there is an increase in biological noise, then somewhat a plateau, an additional increase, and at some point exponential increase in biological entropy or decay of regulation. And then people who have arthritis, even though they’re young, they already are biologically older as is plotted on this right Y-axis. Another point here is that, if you are not able to determine precisely everybody’s biological age, which is super important, it is meaningful because there is a plateau. And on this plateau biologically, even though chronologically we are different, but biologically we might be very similar. And that is very, very important to know because even though we can make mathematical simulation, for example, mandatory connecting this dot with this dot in the straight line, it’ll not reflect the biological reality.
Xiaoyue (Serafina) Mei
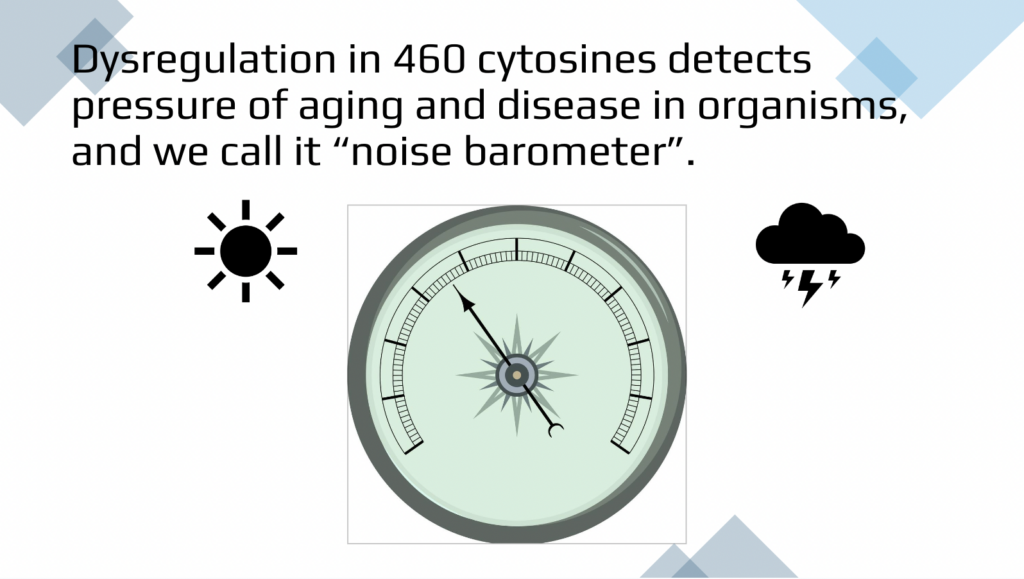
As you can imagine, there is more than one way of selecting the noise detectors. Cytosine that are age-resistant in terms of methylation level and also noisier with age. So we use the based on standard deviation and mean rather than correlation. We use 460 cytosines among those tightly regulated CBGs. We see there is an increase in dysregulation as it goes in the blue healthy group compared to the combined disease status. They are dysregulated even in young adulthood, which is way more noisier than their healthy peers. And they both experienced this a little bit of plateau in the mid-age and a more exponential increase around the later age. If we only select sites that become noisier with age, with ordinary done to stay consistent, then we would expand our pool to more than a hundred thousand sites, which is strong. In the top left of the figure we use 143,000 cytosines.
We still can see an increase of the dysregulation throughout lifespan like disease patients have an increase in noise around the young adulthood, but this is already a big improvement showing this noise compared to the original 480,000 CBGs that is strong in the black dot. So this illustrated that around more than… First of the 480,000 sites shared a characteristic of being increasingly dysregulated with age among the population. So on the top right, we plot a subgroup of 460 sites with at least 20% higher in standard deviation in old compared to young. And then on the bottom right is an example of cytosine that is increasingly noisy with age. And each dot is just its own standard deviation among the individuals in that age interval. We can see this increase in a healthy plateau and continued exponential increase in dysregulation in maturation level for just this one cytosine.
Dr. Irina Conboy
And just to summarize, as much as one fourth of all the measured cytosines or areas of the genome becomes dysregulated then less accurately or entropic with aging. So the noise increases as much as one foot. And that includes all types of changes, when it was more methylated than young, less methylated with older, vice versa, or there was no change. Among this group, even the 460 cytosines that are on average remain the same. They are aging resistant. The noise of those cytosines also increases with aging. So on average they’re the same, but the dysregulation becomes bigger and bigger and bigger in the population of people who are older. Both of these approaches allow us to see differences between healthy groups and patients with diseases. And very importantly, when people grow older, even though they did not report specific diseases for the study, they could have some other diseases. And that’s why blue and red lines often overlap later on in life, but clearly are different for younger individuals.
And furthermore, this progression, this is for the first time you guys see the initial progression of human aging from epigenetics. This progression with the increase of noise, non-perfect plateau, and then unfortunately leaving this healthy plateau and new increase of noise, these can be visualized even with the single one area of the genome just looking at the standard deviation. Once again, this is not a simulation, this is what really happens in biological reality with the primary results that are analyzed under these specific hypotheses that increase in biological noise is the biomarker of aging and disease.
Xiaoyue (Serafina) Mei
And the Venn diagram here with the gray big circle in the middle represents the 143,000 cytosines that become noisier with age. And it shows the presence of such an increasing noisier cytosine in both methods of our search and also in some of the aging clocks. But those other clocks do not overlap with our noise detectors.
Dr. Irina Conboy
This is 460 cytosines divided into more significantly noisy and overall noisy. And these are various different clocks and there is no overlap between our method as expected and mathematical simulation that is done by elastic net regression mandating linear progressions. So our goals for the future is obviously being able to have diagnostic quantification of biological age based on the dysregulation or biological entropy from primary results such as that. An individual will ask us, what is my biological age? And we can perform the test and tell the biological age, quantify it in the randomized blinded fashion. We don’t need to be told what the age is so we can tell it back. And then this is just an illustration that for this individual biological age is perhaps rainy, cloudy with the thunderstorms, which means that there is loads of pressure of aging and disease on this individual, but here there are no clouds and the low pressure and the biological age is young and healthy.
As with any measurement or quantification, this expected to revolutionize development of longevity therapeutics because in order to know if they are functional or non-functional, one needs to precisely quantify in a blinded, not mathematically, simulated way, the biological age to see was it reduced or it was not reduced? Did it work or did it not work? So to give you again, metaphoric example, if you did not have scales, it would be very difficult to lose weight because you’ll be just comparing ourselves to other people and predicting they’ll lose weight. Maybe my pants fit better or maybe I can touch my toes. And maybe people would have delusions that they lost 50 pounds when they lost 31 pounds because there are no scales. And so development of the noise barometer by Serafina and our team then makes this breakthrough that now steps on a scale, let’s measure your weight and then you can use this as a benchmark to adjust your diet, be happy or to be unhappy with your progress.
In this way, I think that we are already or almost ready to develop it as a translational approach through the company that I co-founded. It’s called Generation Lab as a startup, and our goal is to have FDA approved diagnostic of this quantification of biological age by noise barometer and for any diagnostic randomization of the samples and blended analysis is a must. So this is one of the huge directions.
We would like to acknowledge many people and many sources that helped us to perform this work and also work on a future direction. First and foremost, of course, Aging Journal for highlighting our work as a cover story priority source, and giving us this opportunity to explain and discuss it in more detail. And of course finding sources, NIH and NHLBI and philanthropic sources that support the progress of the Conoby Laboratory. We are working in the Department of Bioengineering at University of California Berkeley, and we are part of the Quantitative Biology Institute, which is the merger between UC Berkeley, UCSF and UC Santa Cruz.
All of the entities have a dynamic egalitarian college atmosphere, which helps us to succeed. And then, I also would like to thank of course Serafina, whose name is-
Xiaoyue (Serafina) Mei
Xiaoyue Mei.
Dr. Irina Conboy
Xiaoyue Mei. And then she basically worked on every part of this paper and particularly almost single-handedly on the noise barometer. And then Joshua Blanchard. He was the former brilliant undergraduate student who then fai- tested in maturation clocks and was the very first person to demonstrate that when we do it systematically with good controls, there is no difference in age predictions between healthy people and patients with various diseases. Connor Luellen performed watershed work on this paper during his PhD rotation, which again says a lot, brilliant person. And even though now he moved to his biophysics program and is working on something else, he had this ingenious idea to start discarding unimportant features and then noticing that elastic net regression machine learning model is not really intelligent enough to keep the previously selected features and start throwing them out and replacing them.
Roland Skinner, Nathan Wong and Victor Chang worked by discussing our findings. They were very skeptical actually of our critique of elastic net regression models and their skepticism helped us to strengthen our hypothesis and conclusions and do more experiments. Roland also contributed to the referencing of the manuscript and some of the equations, and he’s currently working on his excellent, innovative approaches along the lines of biological age and risk of disease quantifications.
Thank you once again everybody for your attention to our discussion and please don’t hesitate to contact us if you need more information or would like to chat about science. Bye-bye.
Xiaoyue (Serafina) Mei
Yes, thank you.
Click here to read the full research paper published in Aging.
—
Aging is an open-access, traditional, peer-reviewed journal that publishes high-impact papers in all fields of aging research. All papers are available to readers (at no cost and free of subscription barriers) in bi-monthly issues at Aging-US.com.
Click here to subscribe to Aging publication updates.
For media inquiries, please contact [email protected].