Dr. Leonid Peshkin from the Department of Systems Biology at Harvard Medical School details a research perspective he co-authored that was published by Aging (Aging-US) in Volume 16, Issue 4, entitled, “On standardization of controls in lifespan studies.”
Behind the Study is a series of transcribed videos from researchers elaborating on their recent studies published by Aging (Aging-US). Visit the Aging (Aging-US) YouTube channel for more insights from outstanding authors.
—
Hello, my name is Leon Peshkin. I’m the senior author on this paper I’m (presenting) to you today. It recently came out. The title is “On standardization of controls in lifespan studies.” And the reason we felt compelled to release the study is what we call a life cycle of elevator speech science in the field of aging. It is a satirical representation, but we seem to be going in cycles where a new theory of aging comes out, related intervention is tried in model organisms and results are published, which contain certain measurements of health and health span, physiology and things like this. But also lifespan. And lifespan is precious data because those are hard numbers.
So then the theory goes out of fashion, sometimes becomes dormant or goes away altogether, and literature goes to oblivion. Of course, the way we feel the things should evolve is that regardless of corresponding theory and intervention, the data should be still reusable. So collection of all of the papers where different interventions are tried in the particular organism has high value to be analyzed together, perhaps analyzed by machine learning methods or modeling methods, and there are certain things which prevent it today. So that’s the gist of our paper and I will illustrate it using some examples.
This study itself is not important, it’s just an illustration. This is a study where over expression of SIRT6 led to extension of lifespan in the certain strain of mice. So if you just contrast the intervention curve in red with control curve in green, it looks very impressive. It looks like intervention has worked. Of course, you could focus on the shape of a particular curve and ask, “Does this shape correspond to what we expect this distribution to look like, coming from our understanding of what are statistical dependencies in this data in general?” And it might or might not look like natural lifespan data. What we’re proposing to do then is to pay attention to exactly which mice, which strain, which conditions were used, and go and look at the literature where same animals were used.
Now what we’re going to do is to add to this plot, lifespan curves for controls and controls only from all other papers in gray. All of the corresponding papers are cited here, and what becomes immediately clear is that apparently this effect is not so impressive. This so-called life extension in red, looks pretty ordinary compared to other study controls, but control in this particular study was apparently pretty short-lived. Unfortunately, no matter where we turned, the life extension effect in the presence of this literature-wide control, looked unimpressive.
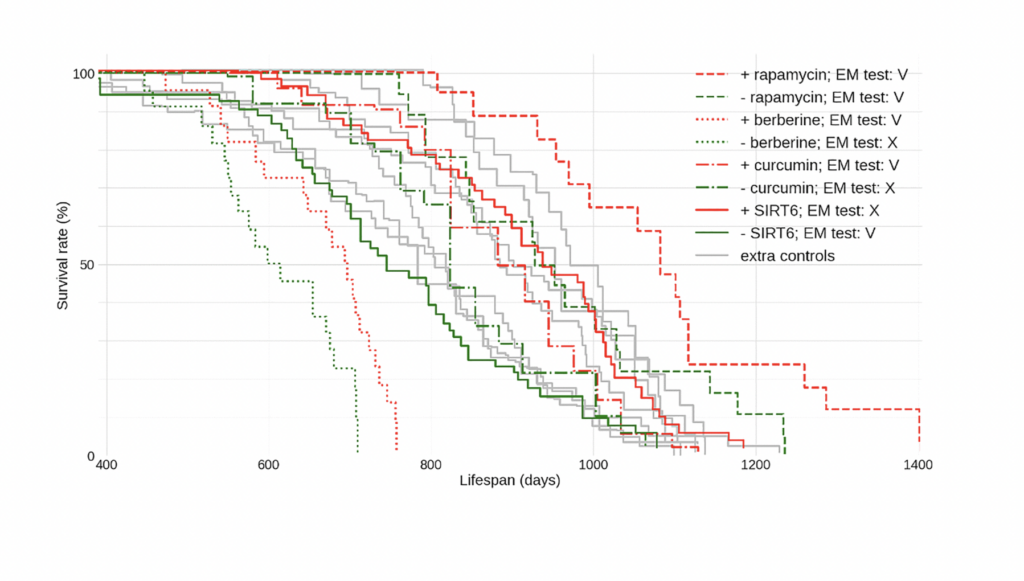
So these are just other examples. Here is curcumin again in the presence of controls. And here’s berberine. Berberine, both control and intervention lived much, much shorter then again, same mice of same strain in other papers. So in this case, taking berberine would be like taking some sort of drug which helped certain group in a particular condition but not healthy controls. For example, if particular therapy extended life of cancer patients, which would be of course great, it would not be an argument for all of healthy controls to follow this intervention to extend their natural lifespan. Rapamycin, which is the most cherished intervention sort of stands the test of comparison to literature-wide controls, but again, becomes least impressive. So you could ask, “How does one analyze a lifespan curve with respect to two different criteria?”
One criteria is, does this particular curve look the way it is supposed to look? The other one, does this difference between control and intervention look statistically significant in the presence at the background of all of those other control? And we found a way to calculate both of those. We additionally propose a data format, which makes it much easier to collect the data across all of those studies and contrast it.
We created the website where you can go and submit your data, browse existing data, compare the data across multiple studies, and calculate those coefficients, which we hope is going to be very useful to this community to develop some good standards and reuse all of the data despite certain interventions going in and out of fashion.
And I thank you very much for your attention. If you would like to know more about the work in the field of aging by my group, you’re welcome to follow this QR code. Thank you very much.
Click here to read the full study published by Aging (Aging-US).
—
Aging (Aging-US) is an open-access journal that publishes research papers bi-monthly in all fields of aging research and other topics. These papers are available to read at no cost to readers on Aging-us.com. Open-access journals offer information that has the potential to benefit our societies from the inside out and may be shared with friends, neighbors, colleagues, and other researchers, far and wide.
For media inquiries, please contact [email protected].