The Longevity & Aging Series is a collaboration brought to you by Aging (Aging-US) and FOXO Technologies. This monthly series of video interviews invites Aging researchers to speak with researcher and host Dr. Brian Chen. Dr. Chen is an adjunct faculty member at the University of California San Diego and the Chief Science Officer at FOXO Technologies.
—
Below is a transcription of the second installment of the Longevity & Aging Series, where Dr. Steve Horvath, revisits 29 papers he co-authored that were published by Aging (Aging-US) and featured as a special collection of his research.
Thank you everyone for joining us on another part of the series with aging. I’m Brian Chen, Chief Science Officer at FOXO Technologies. I’ll be your moderator for the day. Today, I have a special guest that needs no introduction, Dr. Steve Horvath. I’ll ask him to give a brief bio about himself in a minute, but the goal of today is to have him, in his own words, walk us through essentially the history of the development of epigenetic clocks, and the journal Aging has played an important role in that. So Dr. Horvath, would you like to introduce yourself?
Sure. So my name is Steve Horvath. I work on molecular biomarkers of aging, particular interest in methylation-based biomarkers of aging. I’ve been a professor at UCLA in human genetics and biostatistics. More recently, I’ve started a new employment at Altos Labs in San Diego. I’m here to talk about many articles related to epigenetic clocks. Epigenetic clocks are multi-varied predictors of age, or mortality risk based on cytosine methylation. Cytosines are one of the letters in the DNA, A,C,T,G, and a lot of my work has focused on cytosine methylation, which accrues with age at certain locations. Conversely, there’s also loss of methylation with age at other locations, and by keeping track of both of these aging patterns, one can develop very accurate estimators of age and mortality risk in many mammalian species.
Perfect, and that’s exactly what an epigenetic clock does, right? These are algorithms that take epigenetic data, and then can calculate biological age, et cetera. Great. That’s the topic of today’s conversation. So with that, we’ll jump in.
The articles will appear in chronological order. For many articles, I give meta comments, such as what my opinion is of this article, and follow up studies, and so on.
The cerebellum ages slowly according to the epigenetic clock
So I’ll start with the very first article that I published in Aging, which is entitled, The cerebellum ages slowly according to the epigenetic clock. It’s really the main finding of this study, but I could have given it a different title. I could have entitled it as studies of supercentenarians. So in this article, we analyzed many different organs from people, and here I show you first results from middle-aged people, as opposed to centenarians. The bars show different tissues, post-mortem tissues. The Y-axis shows the pan-tissue clock. This clock applies to all human tissues, and what you see is overall, there isn’t much of a variation. Most tissues have roughly the same age in middle-aged people. However, the question is what happens when we look at centenarians? Maybe we find pronounced differences across organs, and this study was done here.
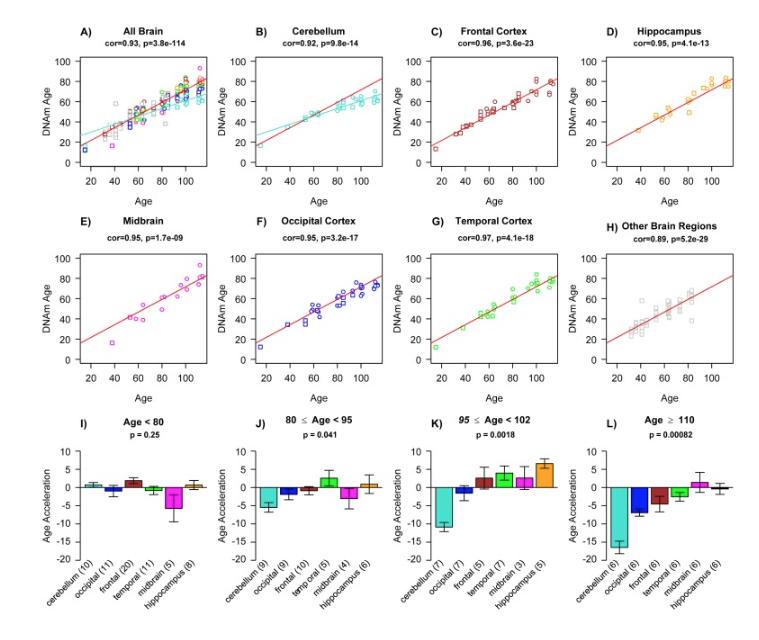
So there was a 112-year-old lady, and she donated her body to science, and we analyzed 30 different organs. This is in panel A, and you notice that in her, the cerebellum showed negative age acceleration. Age acceleration is the discrepancy between methylation age and chronologic age, and what we observed is the cerebellum and several other brain regions are much younger than all the other organs. The other panels show these similar results in brain samples from other supercentenarians. So this person was 114 years old. Again, the cerebellum is much younger than all the other brain regions. So this is already our main finding. The cerebellum is really the part of the body that ages the least in humans. Fast forward into now, 2022, I can tell you that this result holds for many mammalian species, but not all. So we looked at mice, and rats, and so on, and I was hoping that this finding would hold for all mammals, but that’s not true. Just for certain mammalian species.
The article then looks at a potential explanation. Why is it that the human cerebellum is much younger? So we did a transcriptomic analysis, which has a lot of limitations, but we compared the gene expression data in the cerebellum to other brain regions, and here biological processes that come up, mRNA processing, RNA binding, helicase activity. At the time when I wrote the article, I was very intrigued by this aspect of helicase activity, because it reminded me of Werner syndrome, but if I had to write the article again, I would actually probably focus on this mRNA processing transcription, because in our recent studies, in many mammalian species, we keep finding the great importance of mRNA processing. mRNA processing is splicing, so maybe the insight is that the cerebellum does something quite different when it comes to mRNA processing compared to the other brain regions, and compared to other organs. I should tell you, when I developed the pan-tissue clock back in 2013, there was one part of the body that gave me a lot of trouble, and it was the cerebellum.
I must have spent months on that problem: what to do with the cerebellum? This article really explained to me personally why I had such problems, and the reason was because the cerebellum ages more slowly. Whereas I thought that, oh, maybe I had bad training data. I thought it’s a data quality issue, but moving to the next article.
Epigenetic age analysis of children who seem to evade aging
This article has been largely ignored, but it was a huge effort to create the data for it. So, this was a collaboration with Richard Walker. Richard really studied children that didn’t seem to age. So the title says it all, Epigenetic age analysis of children who seem to evade aging. These children have a severe developmental disorder where they remain eternal toddlers. So here’s one girl at different ages. This is at age 15. So this girl never learned to speak, and she didn’t seem to develop, and didn’t seem to age. That’s why Richard Walker was so interested in these children.
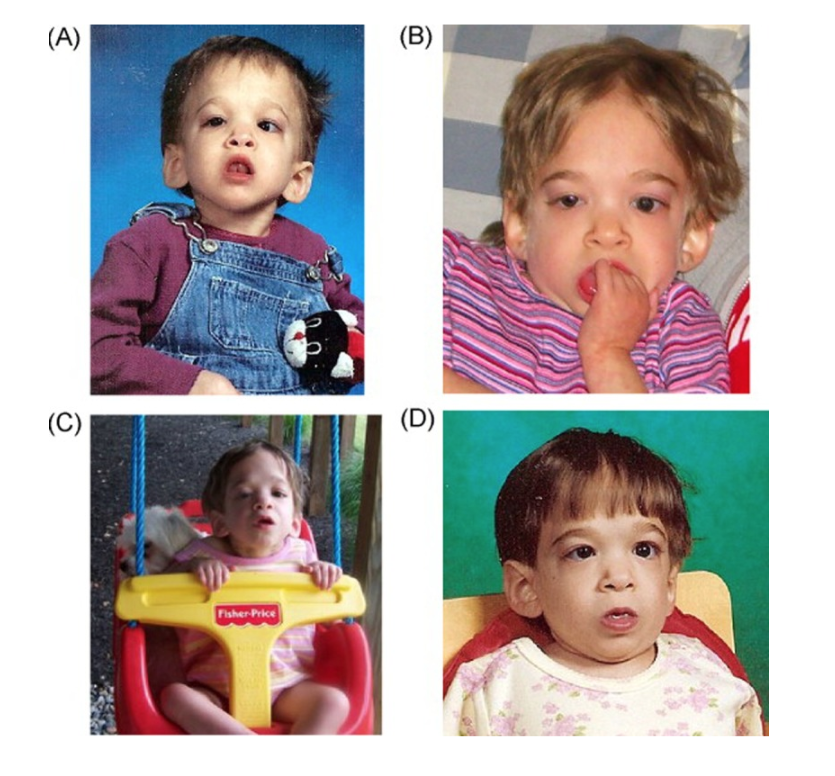
Also, these children had received a lot of media attention, because the hope was that there’s some mutation that could arrest aging in children, and teach us a lot about how to slow aging in older adults as well. Anyway, so we analyzed many such children. Many is a strong word. Many relative to how hard it is to collect, and to find these children. But when I analyzed the blood of these children, I didn’t see a difference. So maybe you can see here in panel C, this is now syndrome X. So these children with this curious disorder are called syndrome X children, and the age acceleration is around zero, because my epigenetic clocks work perfectly well in these children. They tracked aging. So at least at the molecular level for methylation, these children very much developed and aged. So anyway, that was that study, but you do see this blue bar, and there we had one child who had Down syndrome. Now this is statistically not significant, because sample size of one, but you see this one child had severe age acceleration, and I can tell you this finding is true.
So very recently I studied blood samples from newborns with Down syndrome, and controls, and again, newborns Down syndrome cases have also epigenetic age acceleration. This is also observable when we look at mouse models of Down syndrome. So my opinion is that Down syndrome is the ultimate progeria when it comes to epigenetic clocks. Very robust effect, not just in blood, but also in brain tissue.
DNA methylation age of blood predicts future onset of lung cancer in the women’s health initiative
Moving on, this is a paper regarding cancer. This analysis was carried out by my former postdoc Morgan Levine, who was very interested in lung cancer. She found that blood methylation data in the Women’s Health Initiative are predictive of future onset of lung cancer. This study was a little bit underpowered, but what I can tell you is that in later studies people carried out large meta-analysis of epigenetic age acceleration in blood versus incident cancer. If you have large sample sizes, you do find an association. So yes, these epigenetic clocks are predictive of future cancer. But the question is: Is that clinically relevant? My opinion is no, because the effect sizes are simply too weak.
So now I need to emphasize this pertains of course, to blood methylation based on PBMCs. So, that’s my statement. These methylation data are not informative for the clinical use. However, as you know, there’s a totally different school of thought where one looks at extracellular DNA shed by tumors, and they’re companies that commercialize these tests for early detection of cancer. So, that works beautifully apparently, but long story short, as I said, overall, epigenetic clocks do predict future onset of cancer in large cohort studies.
Decreased epigenetic age of PBMCs from Italian semi-supercentenarians and their offspring
This is now a completely different paper. This was a collaboration with Claudio Franceschi and his Italian collaborators. We were very interested whether centenarians age more slowly according to epigenetic clocks. That’s the question. However, to do that study properly, you need to use a trick, which is you cannot look at centenarians per se. Rather, you need to look at the offspring of centenarians, because then you can find age matched controls. So, this study involved this Italian cohort, and the scatter plot shows you the methylation age on the Y-axis, versus chronologic age.
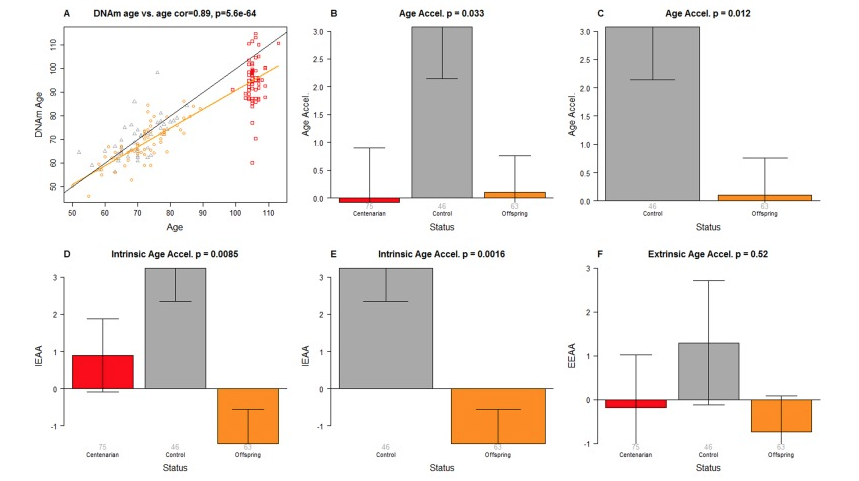
The dark dots are the offspring of regular folks, people who died early on. The orange dots are the epigenetic ages of the offspring of centenarians. Sure enough, we found, as you can see in these bar plots, that the offspring of centenarians were epigenetically younger, according to several different epigenetic clocks. I really like this finding. It makes, obviously, biological sense. However, I would’ve loved it if somebody had validated it, and I’m really not familiar with any study who even attempted to validate it. So this was a study of Italian centenarians, but this should be repeated in offspring of maybe Japanese centenarians, or any other population. So I just don’t know whether it validates in other cohorts.
Increased epigenetic age and granulocyte counts in the blood of Parkinson’s disease patients
Moving to another article, collaboration with Beate Ritz, who is very interested in Parkinson’s disease. We looked at blood samples and saliva samples from Parkinson’s disease patients, and the title of the paper summarizes the two main findings. Increased epigenetic age and granulocyte counts in blood of Parkinson’s disease patients.
Let me make some comments about… My main interest was, of course, increased epigenetic age. That’s why I studied these individuals. However, our software also allows us to estimate blood cell composition based on methylation data. There’s a software called Houseman method that imbues, for example, granulocytes, which are mainly neutrophils. So this finding that neutrophils are much more abundant in blood of Parkinson’s disease, was an accidental finding. I can tell you this finding validates in every study of Parkinson’s disease globally, different populations. Interestingly, PD patients have higher abundance of neutrophils. But what about the first finding, increased epigenetic age? That finding I would say is weak, and we have a hard time validating it. So maybe I can show you here this analysis. One really needs to look at ancestry. So Caucasians or European ancestry, we found really a weak effect.
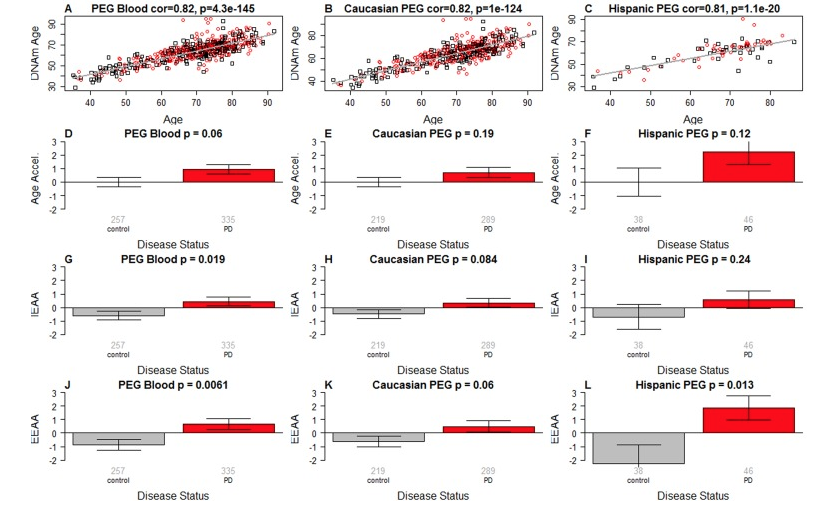
If you carefully look at these bar plots and p-value. P-value 0.06. It’s suggestive p-value. In European ancestry samples, the effect was very weak. However, in Hispanic individuals, there we did see at least for this Hannum-based measure, or EEAA measure, there we did find a stronger effect. I’ve been a member of a couple of follow-up studies of much larger cohort studies of PD, and we did not validate the finding of epigenetic age acceleration and PD in individuals of European ancestry. So take this with a grain of salt. However, as I said, the other main finding was of course, the aspect of neutrophils and that is utterly robust, that finding, and it is not related to medication used like levodopa, or so on. So to me, people should really look at whether neutrophils could perhaps predict future onset of PD.
Moving to another paper by my former postdoc Morgan Levine. She looked at Alzheimer’s disease, and amyloid load, and various readouts of Alzheimer’s disease in the religious order study.
Long story short is that yes, people with Alzheimer’s disease exhibit epigenetic age acceleration, however, these effects are weak. Stronger effects could be observed when we correlated, for example, neuritic plaque status, or diffuse plaques on neurofibrillary tangles to epigenetic age acceleration. So we did report significant findings, and these findings validate, but for the experts among you, when you look at these correlations, they are often weak, less than 0.1. So the pan-tissue clock really has only a weak association with these neuropathology measures. More recently people have published what I would call custom clocks for cerebral cortex, and they do show much stronger association. So several groups are working on these cortex clocks. I want to briefly mention Jonathan Mill’s group has published a cortex clock, and these clocks, again, show much stronger associations, but I would say overall, epigenetic clocks do relate to AD and related neuropathology measures.
Huntington’s disease accelerates epigenetic aging of human brain and disrupts DNA methylation levels
Now moving to another paper. Huntington’s disease. This is a collaboration with Huntington’s disease researchers William Yang, and many others. We studied human brain samples from Huntington’s disease individuals, and the main finding is that yes, epigenetic aging is accelerated in these brain samples, but not all brain regions. So it was important to remove the effect of the cerebellum. Remember how the cerebellum is different, but here you do see the bar plot in panel D. We compared 205 brain tissue samples from HD individuals to 228 control samples and the p-value is 0.02. What’s the message? These are weak effects. You need very large sample sizes. More recently, we have looked at mouse models of Huntington’s disease, and we looked at brain samples, and same story. Actually, the effects in mouse brains are also quite weak. They were paradoxical findings because there’s a grade of Huntington’s disease, and individuals with high grade, meaning their brain shows severe loss of these medium spiny neurons, suddenly the epigenetic age even appeared younger. So, overall weak effects in Huntington’s disease.
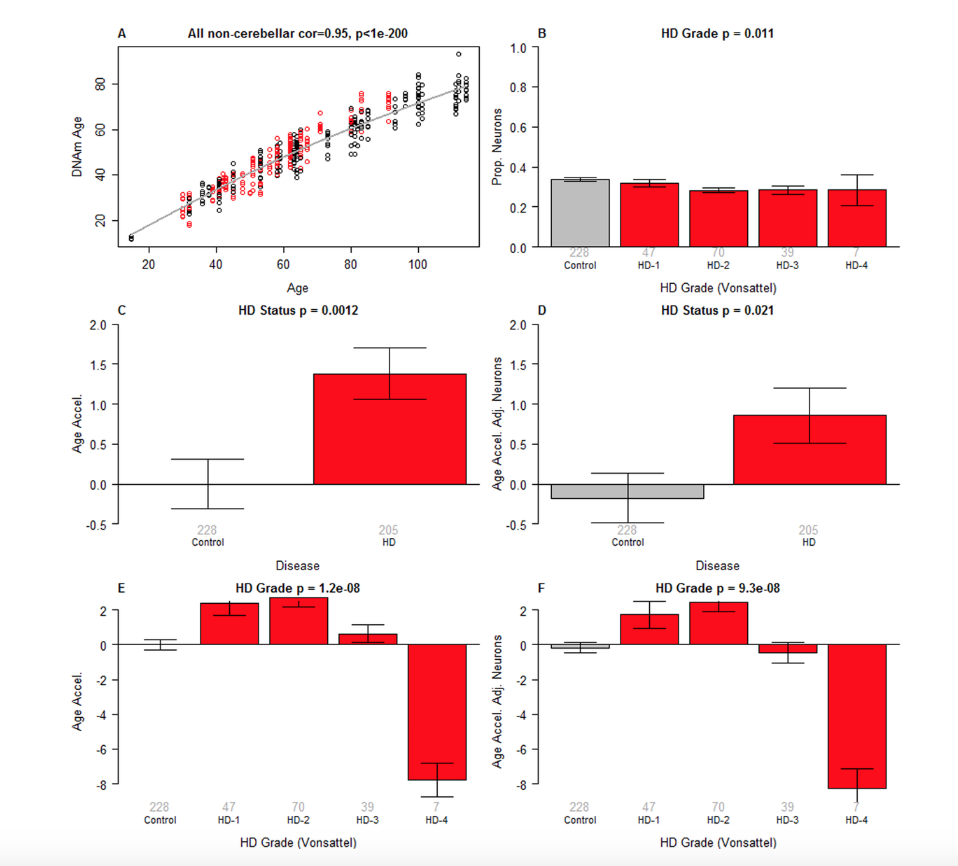
But I do want to draw your attention to another publication where we looked at blood samples, and interestingly in human blood samples, we did find that people who have manifest HD, they also exhibit epigenetic age acceleration in blood already.
DNA methylation-based measures of biological age: meta-analysis predicting time to death
Moving to one of the most important articles. This is from Brian Chen. He looked at a meta-analysis of predicting time to death. To give you a bit of background, when I developed the first epigenetic clocks, it wasn’t clear at all whether these clocks are biologically interesting. Why? They were defined to predict chronologic age, and there was no evidence that they would be biologically interesting. Here Brian showed in the largest cohort study, over 13,000 individuals, three ethnic groups, European ancestry, Hispanic ancestry, African ancestry, that, yes, these epigenetic clocks predict mortality risk in humans. This work extended a previous study from Ricardo Marioni, who had also done a similar study, but Brian’s work extended these results to other ethnic groups and just much larger sample size. So here you see the table of cohorts, 13,000 people, which was really a large logistical effort to get all this data.
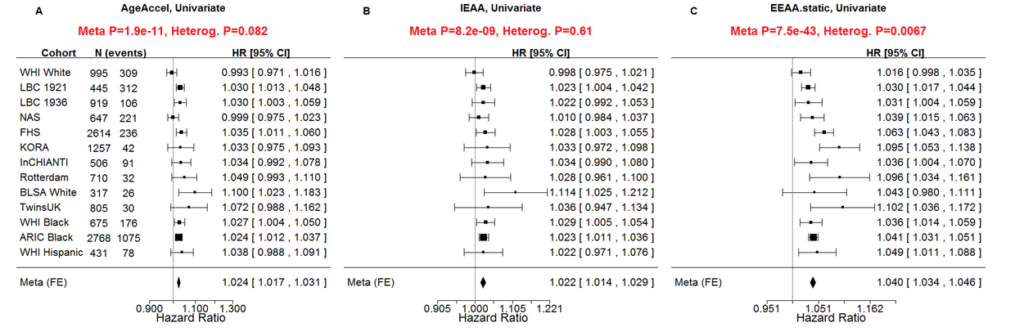
And this is the key figure that showed hazard ratios for mortality risk due to all-cause mortality. And I think the P-value is 10^-11, 10^-9, and the panel C shows 10^-43. So this is a new measure. EEAA stands for extrinsic epigenetic age acceleration. This measure is based on the so-called Hannum epigenetic clock that was developed for blood, but it extended the Hannum clock in an important way. It added measures of blood cell composition, for example naive CD8 T cells, and therefore amplifying the signal. The resulting mortality predictor was better than the original Hannum clock.
Now, the experts will look at the hazard ratios, and they will be disappointed, because here the hazard ratio is 1.04. But mind you, this is the hazard associated with one year of age acceleration. If you have 10 years of age acceleration, the hazard would be 1.04 raised to the power of 10, so suddenly you have a substantial hazard ratio.
And now this analysis pertains to so-called first-generation epigenetic clocks that measure chronologic age. But in later papers, we developed so-called second-generation clocks that are tailor-made for predicting mortality risk, and I will get to that.
Before moving on, I want to say that Brian did a very comprehensive analysis. He also adjusted for many clinical risk factors, for example smoking history, obesity, prior history of diabetes and so on. And the exciting result was that even after adjusting for all of these potential confounders, the results remained significant, and that supports a claim that epigenetic clocks enhance traditional risk factors of mortality, so they add something. And here are the risk factors. You see alcohol, smoking, history of cancer, hypertension, physical activity, which is protective obviously, and so on and so on. So very comprehensive analysis.
Specific premature epigenetic aging of cartilage in osteoarthritis
Now we’re moving to another article by a Spanish team, and they were very interested in osteoarthritis. And they looked at three different tissues, blood, bone, and also cartilage. And they used my pan-tissue clock. And interestingly, osteoarthritis was associated with increased epigenetic age in cartilage only, but not in the other tissues. And this is a nice example of what we’ve found with many age-related conditions, which is that often they have cell type specific effects. You see age acceleration in one cell type, but not all.
Epigenetic clock analysis of diet, exercise, education, and lifestyle factors
Moving on, this is a study from my former student, Austin Quach, which answered the following question: Does healthy lifestyle affect epigenetic clocks? And so what is healthy lifestyle? Obviously diet, vegetable intake, physical exercise, educational levels is protective, and so on. And in this study, Austin found that epigenetic age acceleration according to the extrinsic clock, the Hannum-based clock, is associated with lifestyle factors, but not my pan-tissue clock. And the results make sense to me.
And before I go there, I want to just show you some of these P-values. So in this study of the Women’s Health Initiative, we had access to a blood measure of vegetable intakes, mean carotenoid levels, and you see that P-value 10^-9. So this extrinsic epigenetic age acceleration measure very much tracks vegetable intake. And then you see also, conversely, risk factors. Insulin, glucose, anything related to metabolic syndrome, obesity, all of that has an effect. Educational level. P-value 10^-10. But we do see these findings mainly for epigenetic age acceleration according to the extrinsic biomarker. The left panel shows you the results for intrinsic epigenetic age acceleration, and the P-values are less.
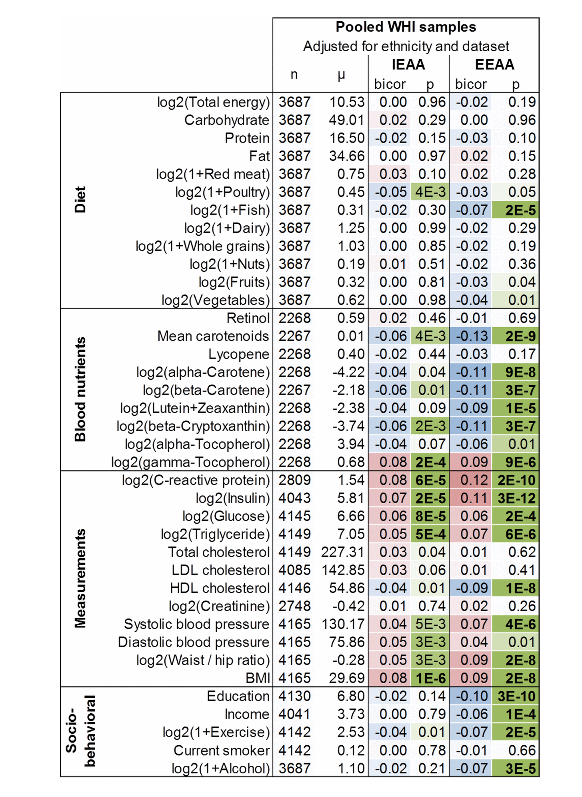
And this makes sense to me, because my pan-tissue clock really measures properties of hematopoietic stem cells. So this clock is very good for picking up somatic mutations in hematopoietic stem cells and so on, but it’s not great at detecting immunosenescence or inflammation and so on. By contrast, the epigenetic age acceleration of the extrinsic clock does relate to blood cell composition by construction, so it does track inflammation and so on. Now, the other analyses in this paper show that these results remain significant after you adjust for various confounders, but I feel the Figure 1 summarizes the main findings.
Longitudinal study of surrogate aging measures during human immunodeficiency virus seroconversion
Now I come to another paper by Janice Leung and Paul Man, who studied HIV. And I can tell you, HIV is one of the conditions that has a pretty strong effect on epigenetic clocks, certainly my pan-tissue clock, and also in multiple organs and tissues. So in this study the authors looked at blood, but I can tell you, HIV also accelerates epigenetic aging in brain tissue and kidney and other human tissues. And so this study just looked at these patients, and they found that, yes, telomere length shortens a little bit with age, but in the very same people you see a much stronger [inaudible] for methylation age, which is a well known finding by now. Methylation clocks have much stronger correlations with age than telomere length. But here is the main finding, that epigenetic age acceleration increased with the days of infection. And there’s quite some literature now on HIV, I should tell you. Again, all these papers validate these findings. And this is also in children, for example. Children who have HIV show epigenetic age acceleration. Heart treatment seems to reverse some of these epigenetic changes.
An epigenetic aging clock for dogs and wolves
Moving to the next article. This was a study by postdoc Michael Thompson, who developed an epigenetic clock for dogs and wolves. I think this was one of the first clocks for non-human species. Other clocks that appeared in the same year described clocks for mice. And so this clock was based on so-called RRBS data, reduced representation bisulfite sequencing data. These data were generated by Matteo Pellegrini, who is an expert on RRBS. And well, here you go. We do describe an epigenetic clock for dogs in this paper. Now I should tell you, I’m about to publish a paper that describes far more accurate clocks based on a particular array platform called the mammalian methylation array. So if you are interested in measuring aging in dogs, I would not recommend this particular clock, because we have far more accurate clocks.
Accelerated epigenetic aging in Werner syndrome
Now I want to move to a study of an important progeria, which is Werner syndrome, so-called adult progeria. And here we studied epigenetic age acceleration in blood samples. This was a study with Anna Maierhofer and Thomas Haaf. And here I show you the punchline. Individuals with Werner syndrome exhibit greatly accelerated epigenetic age according to multiple clocks. And so this study is very exciting. I think I believe it, because I remember I’ve seen a similar phenomenon when we analyzed also, I think, a mouse model of Werner syndrome. So I believe it. But one thing that I would have loved to see it validated in another human cohort. So here you can see we had 18 blood samples from Werner individuals and 18 controls. Sample size isn’t too bad. P-value 0.01. So I do trust it, but I would say it would be wonderful if somebody could try to validate it. And also, one should really look at postmortem tissues. This is a study of blood, but what about brain or liver or any other tissue? Do we see age acceleration? It remains to be seen.
Leukocyte telomere length, T cell composition and DNA methylation age
Now I come to another important article from Brian Chen and Abraham Aviv, who looked at the relationship between leukocyte telomere length and blood cell composition and methylation age. And this study stands out by its very large sample size and also by the fact that the telomere measurements were very carefully conducted by professor Aviv, who used Southern blotting based measurements of telomere length. And the main findings were that, yes, leukocyte telomere length and so-called extrinsic epigenetic age acceleration showed a strong… Showed a significant relationship. I wouldn’t call it strong.
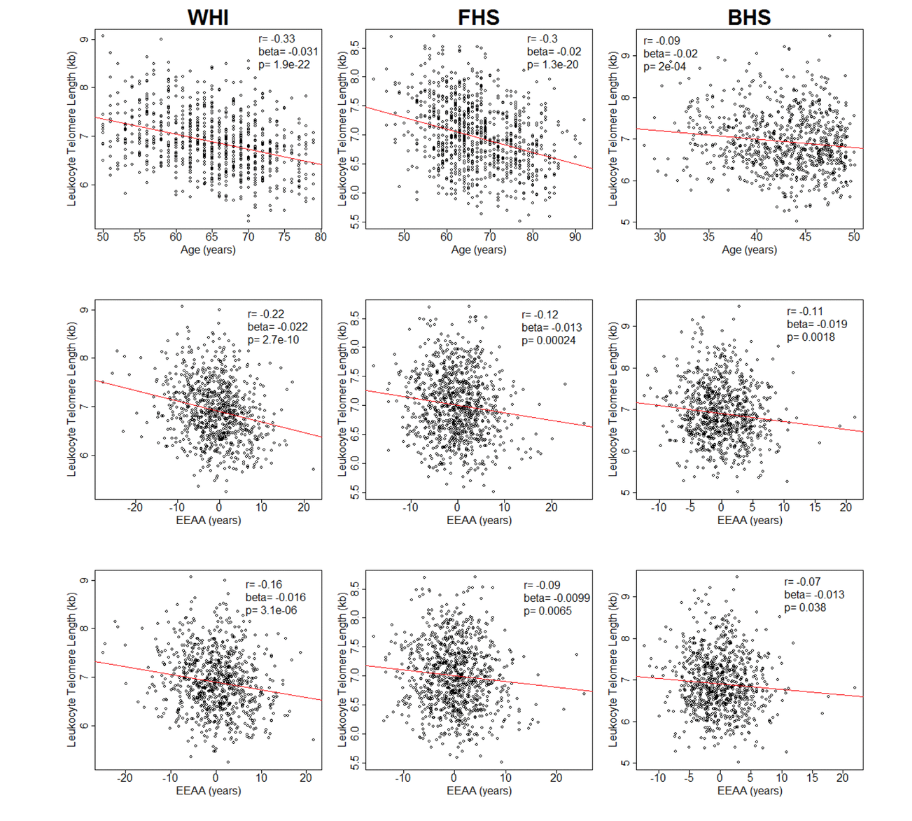
So I want to give you a sense of the effect sizes. So here in the lower left panel. Here Brian shows leukocyte length on the Y-axis. On the X-axis we have epigenetic age acceleration according to the Hannum clock. That’s an extrinsic clock. And you see a correlation, -0.16. It’s statistically very significant because of the large sample size, but it’s a weak correlation. And the results make perfect sense, because EEAA keeps track of the abundance of naive T cells and immunosenescence. And naive T cells, naive cytotoxic T cells actually have longer telomeres. So the results makes perfect sense. So yes, higher level… so EEAA relates, but this is not true for my pan-tissue clock or what is known as intrinsic epigenetic age acceleration. The so-called cell intrinsic epigenetic age acceleration is epigenetic aging after you remove the confounding effect of blood cell composition. After you condition the analysis based on blood cell composition, there is no relationship between epigenetic clocks and telomere length.
An epigenetic biomarker of aging for lifespan and healthspan
Now we come to another paper by Morgan Levine. And this is a important paper, because it describes the first second-generation clocks, or clock. So this clock, which is known as methylation PhenoAge, or phenotypic age, was constructed to predict morbidity and mortality risk in humans. It wasn’t constructed as an estimate of chronologic age. So based on that aim, morbidity risk estimator, we call it a second-generation epigenetic clock.
And the analysis was done in three phases. So first, Morgan found plasma biomarkers that predict all-cause mortality. So forget methylation. It was just proteins, plasma biomarkers of organ dysfunction, that predict lifespan. And that plasma-based biomarker, we call phenotypic age. Now in the second step, Morgan regressed phenotypic age on cytosines, and now developed a methylation-based estimator. So it’s called DNA methylation PhenoAge. Why? Because it’s based on cytosines. And then we related methylation PhenoAge to many conditions, all listed here, to understand the biology.
So PhenoAge is a wonderful predictor of mortality risk compared to first-generation clocks. And it predicts also many other age-related phenotypes. Look at the predicted values for cancer. Very significant P-values. Again, I’m not sure whether it’s clinically relevant, however, in the sense of an epidemiological study. There’s no question that phenotypic age predicts cancer, Alzheimer disease, diabetes, cardiovascular disease, and so on. And then PhenoAge also relates quite strongly to smoking, as expected, because smoking increases your mortality risk. It can be applied to other tissues. Morgan and I occasionally apply it even to fibroblasts. Having said this, we have better clocks for fibroblasts. I actually prefer the so-called skin and blood clock for fibroblasts.
Now here we are talking about in vitro studies. This is a different clock, the so-called skin and blood clock. But I could have named it differently. I actually struggled with the name of that clock for a while, because the original motivation of this clock was to have a clock for fibroblasts. And the reason was that my pan-tissue clock is not very accurate in fibroblasts. I always thought it’s a limitation. So I wanted to have a custom clock for in vitro studies. And the clock described in this article does it. I mean, we use that clock for all in vitro studies.
Now, the clock was really applied then to fibroblast samples from Hutchinson-Gilford progeria. Again, I was always very interested in progeria models, and this Hutchinson-Gilford progeria is… Sorry. The Hutchinson-Gilford progeria, so-called, well, early progeria. It afflicts children. It’s really heartbreaking. You see children that are five years old, and they already have the manifestations of old age, and it’s due to mutations in the LMNA-associated gene. And we secured fibroblast samples from the Progeria Research Foundation in New York. We analyzed all of them.
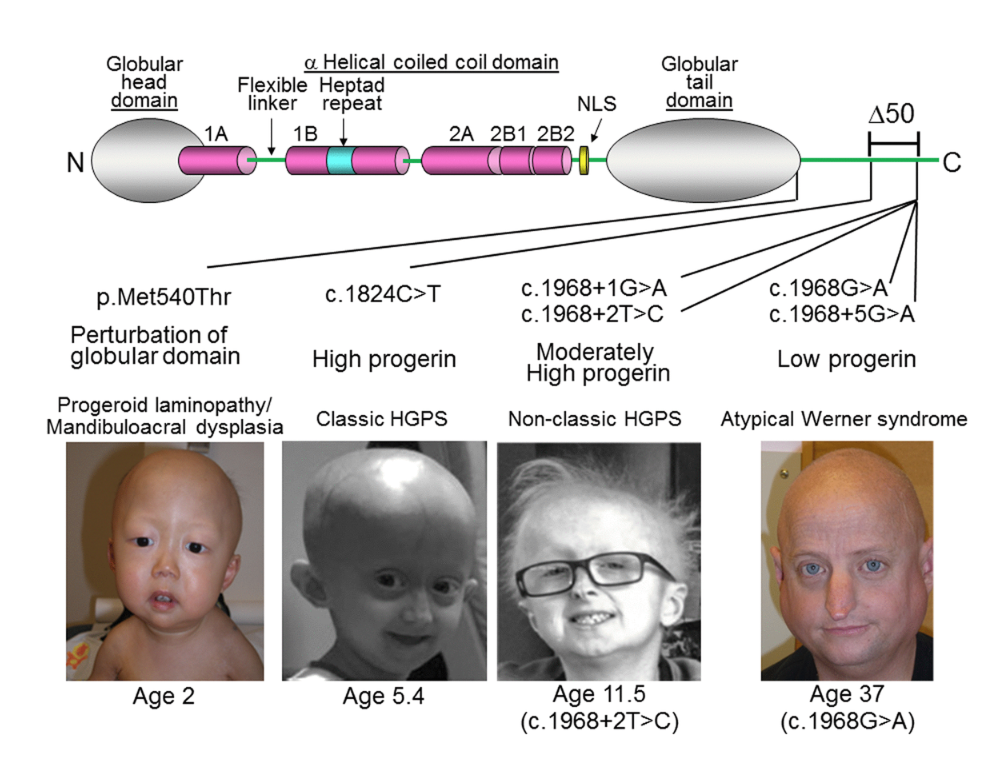
And this panel shows you the punchline, that when we apply this new clock for fibroblasts to these fibroblast samples from progeria patients, we do see epigenetic age acceleration, but the effects are weak. Weak effects. So P-value 0.02, I would say. And let me mention, when I applied my original pan-tissue clocked to these samples, I didn’t see any effect. If anything, I saw the opposite effect. And so I would say, yes, there’s epigenetic age acceleration in fibroblasts, but the effect is weak. And now you could ask: What about if I analyzed blood samples from Hutchinson-Gilford progeria individuals? And fortunately I know the answer, because recently we published a paper that showed that there’s no effect. So interestingly, blood does not show epigenetic age acceleration in this progeria type. And I also looked at mouse models of Hutchinson-Gilford progeria, and there, again, the effects are weak. So overall, Hutchinson-Gilford progeria, despite its strong phenotypic manifestations of aging, really has only a weak effect on epigenetic clocks, at least the clocks that I studied. Contrast Hutchinson-Gilford progeria to down syndrome. Down syndrome, huge effects.
Now, moving to another paper. This is a paper from Ken Raj, who is really an expert on in vitro studies. And he showed in this paper definitively that epigenetic aging is distinct from senescence, cellular senescence. And in particular, it’s not prevented by telomerase expression. As you know, telomerase expression immortalizes cells. It prevents replicative senescence. But it does not stop epigenetic clocks.
And this paper does many things. It’s a very careful study from Ken Raj. And for one thing, he used many donors. And here he first evaluates neonatal fibroblasts. Maybe we go to the right panel, which shows the skin and blood clock that I just described. Why? Because it’s perfect for fibroblasts. The X-axis shows cumulative population doubling levels. And what you see is that methylation age increases as you passage the cells.
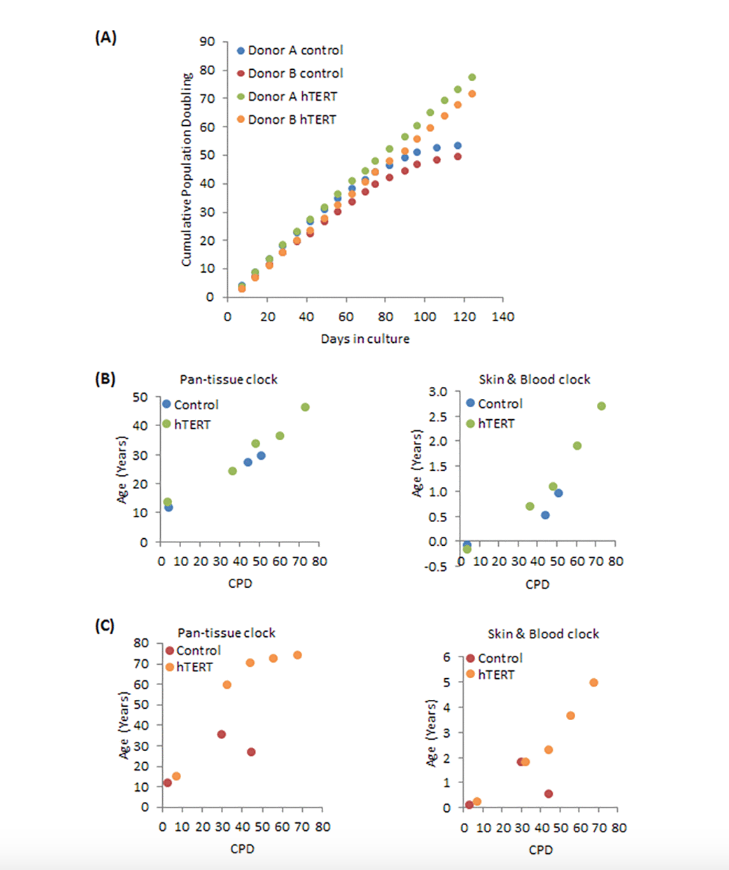
But interestingly, the lower panel shows when you immortalize cells, the hTERT-immortalized cells, they continue to exhibit increases in methylation age. To explain that, by CPD around 45 or so these cells senesce if they haven’t been immortalized. However, the orange dots are the immortalized cells, and you see continuous increase. So it’s a very nice study.
But the paper does a lot more, because in this study, we looked at mutants of hTERT. So there are different ways of mutating the telomerase. And so for example, you can mutate telomerase synthesis or extension of lifespan and so on, so various mutants. And the punchline was that any mutation that led to an extension of proliferative lifespans, or any mutations of hTERT that still maintained this property that the cells could proliferate and avoid replicative senescence. Any of those mutations did not affect the epigenetic clock. It didn’t stop it. And it showed that telomerase per se has no effect on the epigenetic clocks. It’s all about the property that telomerase can extend the replicative lifespan, and that leads them to an increase of methylation age.
A multi-tissue full lifespan epigenetic clock for mice
Moving to another study. So here, Mike Thompson described a epigenetic clock for mice. It’s based on, again, RRBS data generated from Matteo Pellegrini’s lab. And this was the third publication that before we published our RRBS mouse clock, there were several other groups that published RRBS based mouse clocks, Vadim Gladishev’s team and also Wolf Reich’s team and UCSD Team, Idicaol. So there were several groups that published RRBS based clocks. This is yet another incarnation.
By being late, we have the largest training set. This clock and all of these RRBS based clocks are being used in various publications. But I should tell you, I have far more accurate mouse clocks based on an array, so array based clocks are more accurate.
Cell and tissue type independent age-associated DNA methylation changes are not rare but common
Moving on. Here, I show you a study by Andrew Teschendorff. The title says, “Cell and tissue type independent age-associated methylation changes are not rare but common.” And to explain the motivation of this study, there was a paper where the author said that age effects are not preserved across tissues. So in other words, if cytosine, let’s say, gains methylation in liver, that cytosine may not gain methylation and blood. And this paper was correct, actually overall most aging effects are tissue specific, cell type specific. So that’s true.
However, the paper may have led to confusion because people will then think, “Okay, aging effects are tissue specific, cell type specific.” And Andrew Teschendorff really beautifully showed that there are highly conserved cytosines conserved across tissue types. So in other words, of course you can find thousands of cytosines whose gain of methylation in blood replicates in 10 other tissues in humans. The biology is also well understood. These cytosines are often located near sites targeted by polycom repressive complex tool, and more generally by variant chromatin regions. And so this was a very careful study by Andrew Teschendorff. And I think where he looked at and demonstrated high conservation in different blood cell types, but also fibroblast and so on.
DNA methylation GrimAge strongly predicts lifespan and healthspan
Now we come to another paper by scientist Ake Lu, who developed our best mortality risk predictor, which we named after the Grim Reaper for a reason. So this is called DNA methylation GrimAge, and it strongly predicts lifespan and healthspan. It makes a strong claim, but I can assure you, this has been replicated in 20 other papers. Often I give a talk to people and I say, “If you don’t replicate this finding for GrimAge, I will pay for your data,” because it does replicates it. It does predict a lifespan. And so here, Ake defined the second generation clock as a predictor of time to death using a Cox model where she used age and gender actually as explicit covariants. So do you see, this is not an age clock or age estimated. It estimates mortality risk. Age and gender are covariate.

But another attractive feature of this biomarker is that it’s very interpretable. The cytosines that underlie it can be interpreted as estimating various plasma proteins, for example, growth differentiation factor 15, which is one of the top genes that are related to cellular senescence, interestingly as a so-called SAS genes, or PI one, this is plus activator inhibitor one, also a well known biomarker. But do you see, you read PI one and you think protein, but to emphasize it, this is strictly a biomarker based on cytosine methylation. So it estimates type one levels in the blood. And so in this study, Ake showed very impressive P values for mortality risk, 10 to the minus 75 in all these different cohorts. And there was an interesting finding. In the lower panel here, you see on lower right, you see that we have a methylation based estimate of smoking pack years, smoking history. And what you can observe is that the P value is 10 to the minus 47.
But the interesting thing is that the methylation based estimate of smoking pack years outperforms self-reported smoking history when it comes to mortality risk. And this finding has also been validated in several independent studies. So curiously methylation may simply measure vulnerability perhaps to smoking. Or conversely, maybe people have recalled bias, they don’t fill out the forms correctly. This study does many other things. For example, it relates GrimAge to fatty liver disease, it relates it to diet, it relates it to omega three supplements, and it always shows the expected relationships.
Moving on, this is a study by Shigemi Matsuyama, who looked at human fibroblasts in vitro, and he showed for the first time that hypoxia slowed epigenetic clocks. And further, he showed that extra expression does not stop epigenetic aging, similar to the paper from Ken Raj, so he validated it. But what is novel here, she gave me also evaluated SV40 largeT immortalization. And the thing is we didn’t quite find anything for SV40 largeT. The results were a bit ambiguous. So I feel this study should be repeated with larger sample sizes. But in any event she showed very nicely that hypoxia slows the epigenetic clocks. Here, you see these P values of the slowed effects, according to two different clocks, skin and blood, the blood clock and the original pan tissue clock.
Now we come to another paper from Ken Raj, who carefully evaluated rapamycin, which obviously is of great interest to the aging community. And he found that rapamycin slowed epigenetic aging of keratinocytes. And that’s a remarkable finding because when we looked at the effect of rapamycin on blood, we never saw a beneficial effect. However, this effect I trust because Ken looked at several different donors. It’s very reproducible. And so I’ve encouraged the community and everyone who listens to carefully evaluate whether rapamycin maybe slows epigentic aging in human skin, right, because keratinocytes are in the skin. But in other studies, I looked at the effect of rapamycin on the blood of marmosets, which is a monkey. And also in a much smaller human study, I didn’t observe an effect on human blood.
Placental epigenetic clocks: estimating gestational age using placental DNA methylation levels
Moving onto another clock, which is based on placenta. So it turns out the placenta is really different from other cell types, drastically different when it comes to aging effects, which means when you have any of the clocks I mentioned, the pan tissue clock, the skin and blood clock, but any of these clocks, they will simply not apply to human placental tissue. The biology is completely different. But here, Yunsung Lee developed placental clocks that are tailor made for measuring gestational age of the baby based on methylation in the placenta. And the accuracy is remarkable. So we have here clock on the left panel, this is our novel clock. I should tell you, there was a previous publication a couple of years earlier by Mayard at Al that also had a placenta clock. And here we just compare our placental clock to the clock by Mayard when it comes to estimating gestational age of the baby. And both clocks work, but I think you can see this clock is remarkably accurate, correlation 0.82 or so. In this case 0.99. Very accurate.
Optimism is not associated with two indicators of DNA methylation aging
Moving on, this is a different study by Eric Kim and Laura Kubzansky from Harvard who looked at whether optimism is associated with methylation age. And this was a negative finding, basically it’s not associated. And I think it’s important to sometimes publish negative findings. Because many people are interested in the topic that’s for example, meditation, or does depression relate to epigenetic aging, there are couple of studies that’s looked at it overall. My impression is that these effects of mood are very weak, probably reflecting that epigenetic aging processes are partially genetic. Okay. So heritability maybe 40% or 20%, depending on who you talk to. They relate often to inflammation. I would say these first generation clocks, at least don’t seem to relate.
DNA methylation-based estimator of telomere length
This is now another paper that presents a novel biomarker that is meant to emulate telomere lengths. So remember how I told you earlier that overall our epigenetic clocks have at best a weak correlation with telomere length, maybe the best is EEAA, which is by construction tracking blood cell composition. And there, the correlation was 0.16. So then we turned it around and said, “Well, why don’t we build a methylation based estimate of telomere?” And this was accomplished here. So we call it DNA methylation telomere length. And please look at the right panel, panel B upper right. The X axis shows you our methylation estimate of telomere length and the Y axis shows you southern blotting based measures of telomere length. And the correlation is 0.44. And you can look at it in two ways, is the glass half full or half empty?
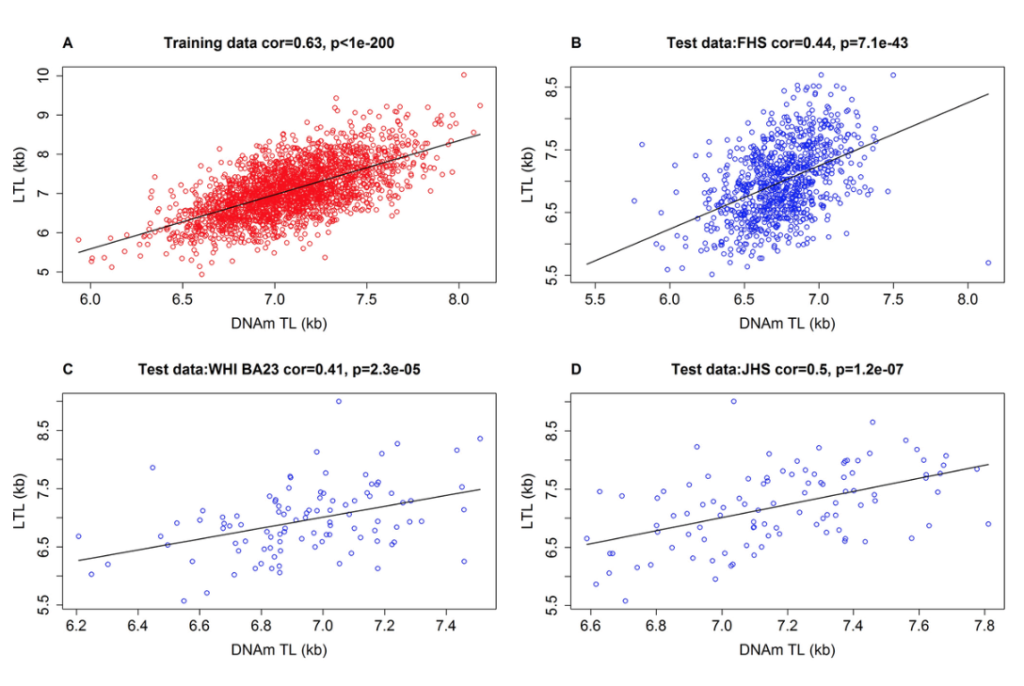
To me, a correlation of 0.44 is pretty strong. So yes, it does track telomere length, but it’s not the same as telomere length for that. So it cannot replace telomere length. It’s a slightly different biology. And this, by the way, holds up. I would say a methyl biomarker DNA MTL, the telomere estimator has a correlation 0.4 roughly with that. But let’s just compare. On the left side, you see actual leukocyte based telomere length on the Y. On the right hand side, you see our methylation biomarker. And on the X axis, you see chronologic age. Clearly, much stronger age correlation for the methylation based estimator. Coming to my statement, leukocyte telomere length has actually only a moderate relationship with age. Do you see here in the framing and heart study correlation -0.31 for telomere length, whereas the methylation biomarker has a correlation -0.62, much stronger.
But there’s more to it. When you ask: Well, what about smoking? So when you look at the effect of smoking on actual southern blotting based telomere length, smoking is barely significant, point P value 0.05. Okay. And these are large sample sizes. So smoking in essence, barely touches telomere length. However, when you look at our methylation based measure of telomere length, there’s a strong relationship, P value 10 to the minus six. And so yes, if you care about tracking the effect of poor lifestyle choices, such as smoking, methylation biomarker would be far better. And then here I show you mortality risk estimates. Left hand side shows you the P value for actual telomere length 0.04, barely significant. If you use our methylation based estimator, P value 10 to the minus nine, much stronger. And anyway, we did a lot of these studies menopause. Our methylation based estimator relates to early menopause.
Women who experience early menopause have slightly shorter telomeres, according to the methylation marker, but not according to actual telomere length. So on all categories, I would say the methylation marker outperforms actual telomere length. But there’s an important caveat, it’s different biology. Telomere length is a very important hallmark of aging, so it should be measured. Moving on.
Epigenome-wide association study of leukocyte telomere length
This is a study where we now looked at individual cytosines that relate to leukocyte telomere length. This is a study by Yungsung Lee. And here we found genes and telomere that have a strong relationship to leukocyte telomere length in different racial groups. And I mean, people who study telomere biology, they should take a very good look at these list of genes. I think it could be quite interesting to understand the biology of telomere length maintenance.
Blood DNA methylation sites predict death risk in a longitudinal study of 12, 300 individuals
Now I move to a different study by Elena Colicino and Andrea Baccarelli and a large group of collaborators that is in essence and EWAS of mortality risk. Remember how we build GrimAge pheno agents on as predictors of mortality risk. This paper has a different aim. It wants to look at individual cytosines and neighboring genes that relate to mortality risk. And so here we found several such cytosines. And interestingly, in essence, all of them relate to smoking. So if you want to understand the biology of mortality risk in humans, cytotines, it’s mainly smoking effects one way or another. However, don’t walk away thinking that it’s only smoking history because from other studies, for example, GrimAge, we know that GrimAge is a beautiful, predictive mortality risk in never smokers, people who never smoke, but you can still predict mortality risk.
Epigenetic mutation load is weakly correlated with epigenetic age acceleration
Moving on, this is a study by Qi Yan, who looked at the question of stochastic epigenetic mutations. So there was an Italian team, again, Claudia Francesci who had introduced the concept of stochastic epigenetic mutation. In essence, you have a cytosine and there’s a mutation. And suddenly the cytosine leads to a drastically different methylation level, three quotas away from the median. So they call that an epigenetic mutation. And for each person, you can calculate the total number of such point mutations to the cytosines and you can relate it to epigenetic clocks. And here I show you how these epigenetic… We call it epigenetic mutation load.
Some people have a lot of epigenetic mutations at cytosines. And what we observe is that this epigenetic mutation load has weak, but significant correlation with our epigenetic clocks. For example, you see here, lower panel, you see correlation 0.24 for GrimAge or 0.18. So yet some of these epigenetic mutations do correlate with our epigenetic clocks. Correlations are weak. They’re not 0.9. And so I would say these stochastic mutations don’t explain everything that is known about epigenetic clocks. There’s more than entropy to epigenetic clocks. There are additional mechanisms that should be mentioned when we try to understand epigenetic clocks.
And the final paper in the collection was published by Emily Pearce and Shahinaz Gadalla, who, again, looked at our methylation based estimate of telomere length and compared it now to flow fish and qPCR based measurements of telomere length. And they showed what I reported earlier, remember how I told you methylation telomere length correlates with actual telomere length correlation around 0.4. So here they found 0.4 and in another study 0.56. So overall this again, highlights the point that our methylation based estimate of telomere length is not the same as actual telomere length. If you want actual telomere length, you have to use another method beyond methylation.
So with that, I conclude the discussion of this special edition. For those who stayed and listened to it all, you are really awesome, you have infinite patience. The only thing that’s tougher to listen to all of that is to actually write the papers. That’s really tough. So thank you for your interest.
Amazing that this is only your publications in Aging, one journal. And I know there’s been many and that you were able to off the top of your head, actually comment on every details on every single one of those. So kudos to you.
And kudos to Aging, I’m grateful that they published so many of my papers.
Click here to read the full Special Collection on Steve Horvath’s Publications in Aging (Aging-US).
Longevity & Aging Series Episode 1: Drs. Alex Zhavoronkov and Frank Pun
AGING (AGING-US) VIDEOS: YouTube | LabTube | Aging-US.com
—
Aging (Aging-US) is an open-access journal that publishes research papers bi-monthly in all fields of aging research and other topics. These papers are available to read at no cost to readers on Aging-us.com. Open-access journals offer information that has the potential to benefit our societies from the inside out and may be shared with friends, neighbors, colleagues, and other researchers, far and wide.
For media inquiries, please contact [email protected].